Nowadays the speed of Internet is much better than in the past, but we can still see websites with high loading time.
Low-performing websites produce several negative side effects, for example:
- "Research has shown that when loading time increases from one to three seconds, a user is 32% more likely to bounce. If the loading time is longer than five seconds, the probability of bouncing increases by 90%. Such experiences can prove rather frustrating, which means that large numbers of users will choose not to return to this page";
- 46% of users don't revisit poorly performing websites;
- low reputation of the website and negative impacts to the business. Ecommerce sites will pratically pay the price for delays;
- bad advertisement for the service, firm or business the website represents.
For this reasons we are going to analyse what affects the performance and usability of a website.
FIRST STUDY: HOME PAGE OF MOST POPULAR ITALIAN NEWS WEBSITE
We have chosen, as small representative sample for the study, the homepage of most well-known Italian newspapers because we think they are accessed every day from lots of users so their performance should be very crucial.
These homepages have been studied using GMetrix [02]: a website performance analytics tool that provides professional reports.
Taking a significant subset of data produced by GMetrix we have the following table:

By calculating the Pearson’s correlation coefficient between the Fully Loaded Time and respectively the Total Page Size, the Total Image Size and the Total of HTTP Requests, we have the results shown in the following table.

The use of Pearson Correlation Coefficient (PCC) reveals: a small correlation between Fully Loaded Time and Total Page Size, a moderate correlation between Fully Loaded Time and Total Image Size and a Strong correlation between Fully Loaded Time and Total of HTTP Requests.
SECOND STUDY: HOME PAGE OF MOST POPULAR WEB SEARCH ENGINE

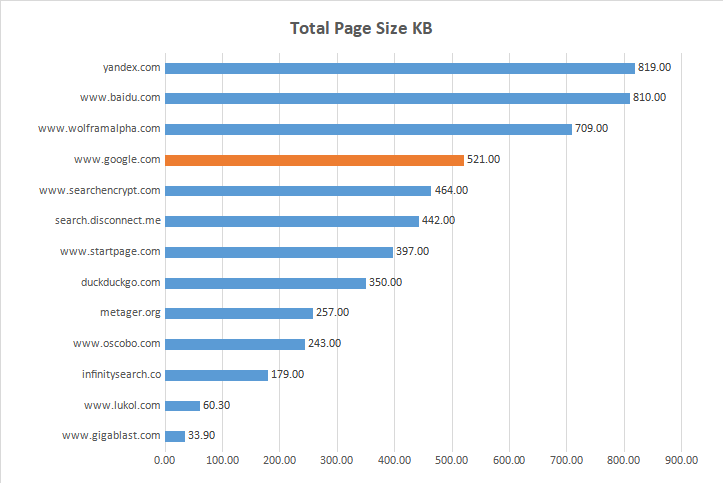
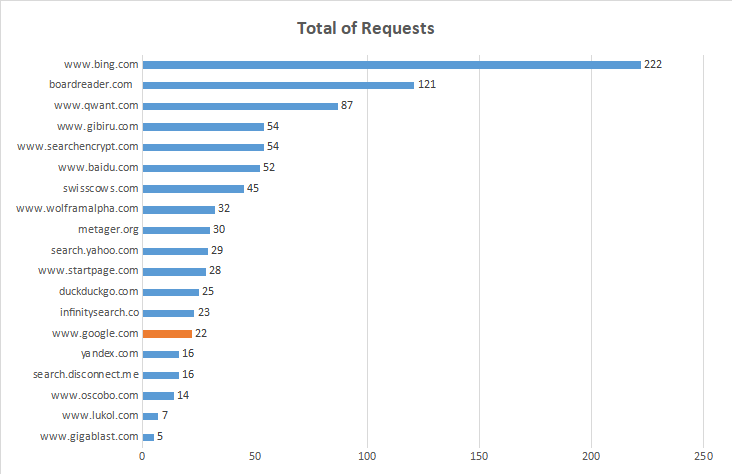
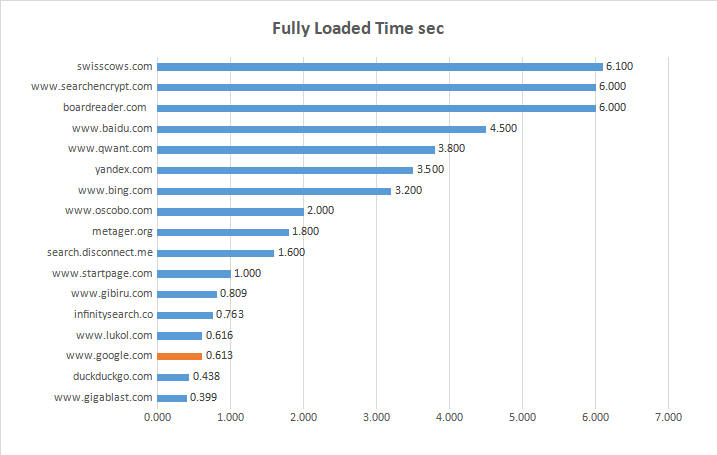
| Website ----------------------*** | Fully Loaded Time sec | Total Page Size KB | Total IMG Size KB | % IMG Size | Total of Requests |
| www.gigablast.com | 0.399 | 33.90 | 30.80 | 80.00 | 5 |
| www.lukol.com | 0.616 | 60.30 | 30.20 | 42.90 | 7 |
| www.oscobo.com | 2.000 | 243.00 | 57.30 | 7.10 | 14 |
| search.disconnect.me | 1.600 | 442.00 | 186.00 | 31.20 | 16 |
| yandex.com | 3.500 | 819.00 | 333.00 | 18.80 | 16 |
| www.google.com | 0.613 | 521.00 | 6.82 | 1.30 | 22 |
| infinitysearch.co | 0.763 | 179.00 | 87.20 | 34.80 | 23 |
| duckduckgo.com | 0.438 | 350.00 | 12.40 | 20.00 | 25 |
| www.startpage.com | 1.000 | 397.00 | 57.70 | 14.30 | 28 |
| search.yahoo.com | 989.000 | 250,880.00 | 180224.00 | 58.60 | 29 |
| metager.org | 1.800 | 257.00 | 84.60 | 66.70 | 30 |
| www.wolframalpha.com | 14.000 | 709.00 | 33.50 | 6.20 | 32 |
| swisscows.com | 6.100 | 932,864.00 | 742400.00 | 60.00 | 45 |
| www.baidu.com | 4.500 | 810.00 | 160.00 | 38.50 | 52 |
| searchencrypt.com | 6.000 | 464.00 | 31.60 | 1.90 | 54 |
| www.gibiru.com | 0.809 | 316,416.00 | 273408.00 | 42.60 | 54 |
| www.qwant.com | 3.800 | 126,976.00 | 289.00 | 19.50 | 87 |
| boardreader.com | 6.000 | 222,208.00 | 9.90 | 25.60 | 121 |
| www.bing.com | 3.200 | 277,504.00 | 115688.00 | 50.00 | 222 |
| www.ask.com | 12.700 | 326,656.00 | 144384.00 | 30.70 | 982 |

| Two Variables | Calculated Pearson correlation coefficient [03] | Value Range | Strength of Association |
| Fully Loaded Time and Total Page Size | 0.1377977 | 0.1 .. 0.29 | Small |
| Fully Loaded Time and Total Image Size | 0.3709692 | 0.3.. 0.49 | Moderate |
| Fully Loaded Time and Total of HTTP Requests | 0.5787809 | 0.5 .. 1.0 | Strong |
RESULT OF INVESTIGATION
The strong correlation (about 0.8 in the first study and about 0.6 in the second study) between the loading time and the total of HTTP requests means that the number of HTTP requests generally have a direct impact on how quickly the web page loads.
Website speed is a key factor in SEO. It affects search engine ranking factor determining search engine placement which is connected to Google’s algorithms.
One way to speed up a website is to reduce the number of HTTP requests. Here are some tips:
- Using CDN (Content Delivery Network);
- Delete unnecessary images;
- Reduce image size;
- Implement the lazy loading technique;
- Minifying CSS and JavaScript files.
REFERENCES
[01] Tai Wen Jun, Low Zi Xiang, Nor Azman Ismail. William Goy Ren Yi, Usability Evaluation of Social Media Website, International Research Journal of Modernization in Engineering Technology and Science, January 2021;
[02] https://gtmetrix.com, GMetrix: How fast does your website load?;
[03] https://www.webpagetest.org/: Instantly test your site’s performance in real browsers, devices, and locations around the world;
[04] https://en.wikipedia.org/wiki/Pearson_correlation_coefficient Pearson correlation coefficient;
[05] https://en.wikipedia.org/wiki/Same-origin_policy Same-origin policy;
[06] https://neilpatel.com/blog/does-speed-impact-rankings/: We Analyzed 143,827 URLs and Discovered the Overlooked Speed Factors That Impact Google Rankings;
Last update on 30/03/2022


